Abstract
In the context of the energy transition towards "carbon peak" and "carbon neutrality" as well as the shift from coal to natural gas, the liquefied natural gas (LNG) industry has experienced rapid development. Nevertheless, frequent LNG accidents pose a serious threat to people's lives and property safety. Based on the statistical analysis of the data of gas accidents that occurred in China from 2017 to 2023, with the aim of exploring the safety risk factors of LNG supply stations, a comprehensive evaluation system for the safety level of liquefied natural gas supply station was established, encompassing four dimensions: human factor, equipment and facilities, environment, and management. By integrating cloud model, improved analytic hierarchy process and entropy weight method, a comprehensive evaluation method for the safety level of LNG gas supply station was proposed. Finally, the method was applied to the H LNG Supply Station in Beijing, the results show that the cloud characteristic values of the risk assessment level of H gas supply station were (7.33, 0.79, 0.22) and the risk assessment results were close to the medium level. The research results verify the effectiveness of the evaluation method, which can provide a theoretical basis for the safety management and scientific evaluation of LNG supply stations.
Keywords
Liquefied Natural Gas (LNG), Analytic Hierarchy Process (AHP), Cloud Model, Supply Stations, Risk Assessment
1. Introduction
In recent years, the process of industrialization and the pace of urban development in China have been continuously accelerating. By the end of 2023, the permanent urban population had reached approximately 933 million, with an urbanization rate of 66.16%, indicating a further increase in the level of urbanization and an overall enhancement of urban functions
| [1] | Guo D, Kong S, Li X, et al. Urbanization and subjective well-being of native urban residents: evidence from the “new-type urbanization pilot policy” in China [J]. The Annals of Regional Science, 2025, 74(1): 4.
https://doi.org/10.1007/S00168-024-01337-3 |
[1]
. Meanwhile, against the backdrop of the energy reform aimed at achieving "carbon peak and carbon neutrality," the gas industry has experienced rapid growth. With the improvement of city gas infrastructure and the ongoing promotion of the "coal-to-gas" policy, both the consumption level and supply capacity of natural gas have been increasingly enhanced
.
Liquefied Natural Gas (LNG), as a clean, efficient, and ecologically beneficial high-quality energy source and fuel, has become an indispensable energy resource in contemporary society. Compared to traditional energy, LNG offers advantages such as ease of storage and transportation, as well as operational safety and reliability
| [3] | Zou X, Qiu R, Zhang B, et al. Roadmap to urban energy internet: Techno-enviro-economic analysis of renewable electricity and natural gas integrated energy system [J]. Journal of Cleaner Production, 2022, 373: 133888.
https://doi.org/10.1016/J.JCLEPRO.2022.133888 |
[3]
. As a systematic project involving the unloading, storage, and gasification of LNG to provide clean energy to users, LNG supply stations constitute a critical component of city "lifelines"
| [4] | Katebah M A, Hussein M M, Shazed A R, et al. Rigorous simulation, energy and environmental analysis of an actual baseload LNG supply chain [J]. Computers & Chemical Engineering, 2020, 141: 106993.
https://doi.org/10.1016/j.compchemeng.2020.106993 |
[4]
. The operation of LNG supply stations involves hazards such as low temperatures, high pressures, flammability, and explosiveness. The processes within LNG supply stations are complex, with densely arranged equipment and pipelines. Furthermore, these stations are often located in economically concentrated and densely populated city areas, meaning that any accident could severely compromise public safety and potentially result in casualties and property losses
| [5] | Zardasti L, Yahaya N, Valipour A, et al. Review on the identification of reputation loss indicators in an onshore pipeline explosion event [J]. Journal of Loss Prevention in the Process Industries, 2017, 48: 71-86.
https://doi.org/10.1016/j.jlp.2017.03.024 |
[5]
. Therefore, assessing the risks associated with the operation of LNG supply stations holds significant practical importance and academic value.
Significant progress has been achieved in the research on risk assessment of LNG supply stations. For instance, Chebli et al.
| [6] | Chebli S, Tolba C, Zennir Y. Risk Assessment of an LNG Storage Tank Release: Case study of LNG storage unit in Skikda LNG terminal [J]. Algerian Journal of Signals and Systems, 2022, 7(2): 53-60.
https://doi.org/10.51485/ajss.v7i2.162 |
[6]
presents a risk assessment for LNG storage tank release to identify pressure-related hazards, establish loss-of-containment scenarios, and simulate accident consequences. Animah and Shafiee
| [7] | Animah I, Shafiee M. Application of risk analysis in the liquefied natural gas (LNG) sector: An overview [J]. Journal of Loss Prevention in the Process Industries, 2020, 63: 103980.
https://doi.org/10.1016/j.jlp.2019.103980 |
[7]
conducted a systematic review and classification of the literature on LNG risk analysis, clarifying risk assessment methods, tools, data sources, and their specific applications in LNG supply stations. Aprilia et al.
assessed the risk levels of process and non-process accidental events during unloading and normal operations at LNG vaporization stations. James et al.
| [9] | James S, Renjith V R. Risk assessment and vulnerability analysis of liquefied natural gas (LNG) regasification terminal [J]. Process Integration and Optimization for Sustainability, 2021, 5(1): 99-121.
https://doi.org/10.1007/s41660-020-00138-3 |
[9]
presents a risk assessment of an LNG storage facility that was performed by integrating a fuzzy risk matrix and layer of protection analysis to determine safety integrity levels for independent protection layers. However, existing research predominantly focuses on theoretical model construction, lacking sufficient data validation and practical application. Furthermore, insufficient consideration has been given to complex operating conditions and human factors, necessitating further improvement in the applicability and accuracy of the evaluation models.
Therefore, based on laws, regulations, and standards pertaining to LNG supply station safety, and combined with practical experience gained from on-site safety inspections, a risk assessment system for LNG supply stations was constructed. This system encompasses 18 risk assessment indicators across four dimensions: human factors, equipment and facility factors, environmental factors, and management factors. The weights of these risk assessment indicators for LNG supply stations were calculated using an improved analytic hierarchy process (AHP) and the entropy weight method. A risk assessment method for LNG supply stations based on the cloud model was subsequently proposed, enabling a comprehensive evaluation of their safety level. This research provides a more scientific and systematic theoretical framework and practical method for the comprehensive assessment of LNG supply station safety, which is of significant importance for enhancing the safety management level of gas enterprises.
2. Gas Accident Statistical Analysis
Due to the absence of publicly available official statistics on gas related accidents in China before 2020, gas accident data for the period 2017-2019 were compiled from public accounts and websites. Furthermore, based on the "National Gas Accident Analysis Report" published by the Safe & Security Management Committee of China Gas Association, gas accident data for the period 2020-2023 were obtained. In summary, gas accidents occurring nationwide in China between 2017 and 2023 were compiled for this study.
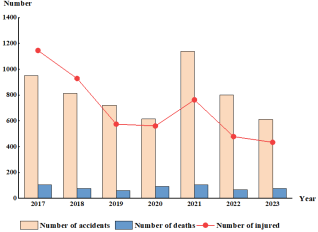
According to the statistics, a total of 5,653 gas accidents were recorded in China from 2017 to 2023. These accidents resulted in 581 fatalities and 4,883 injuries. On average, 807 gas accidents occurred annually, leading to 83 deaths and 698 injuries per year. The statistical data were presented in
Figure 1. An examination of the annual statistics reveals a fluctuating downward trend in both the number of gas accidents and the resulting casualties in China. However, a surge was observed in 2021, with the number of accidents reaching as high as 1,140, accompanied by a significant increase in casualties. This indicates that the situation regarding gas safety in China remains far from optimistic. Several major gas accidents occurred in 2021, notably the "6·13" major gas accident at the yanhu community market in Zhangwan district, Shiyan City, Hubei Province, which resulted in the consequences of 25 deaths and 138 injuries. In response, the State Council Work Safety Committee issued the "National Work Plan for the Investigation and Rectification of City Gas Safety" (Document No. [2021] 9), initiating a nationwide campaign for the investigation and management of the gas industry, which has had a profound impact on the sector.
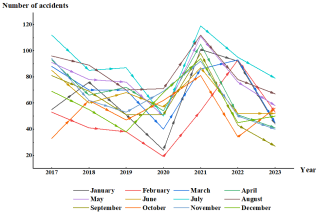
Based on the monthly statistical data from 2017 to 2023, the average monthly number of gas accidents nationwide was approximately 67. Among these, July and August were identified as the peak periods for gas accidents, with the average monthly number of accidents in July reaching as high as 90. The statistical data were presented in
Figure 2.
Further analysis revealed that the occurrence of gas accidents was characterized by a distinct seasonal pattern, with summer and winter identified as peak periods. Accordingly, it was recommended that the frequency and intensity of gas safety inspections be strengthened during these seasons. Through measures such as regular patrol inspections, monitoring and early warning systems, and user safety education, potential hazards can be promptly identified and effectively eliminated, thereby ensuring the safe and stable operation of city gas systems.
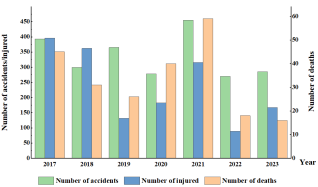
According to the Code for design of city gas engineering (GB 50028-2020), city gas generally includes natural gas, liquefied petroleum gas, and manufactured gas. Natural gas was recognized for its cleanliness, environmental friendliness, high calorific value, and ease of use. The average annual number of natural gas accidents in China from 2017 to 2023 was calculated to be 335, resulting in 34 fatalities and 235 injuries, as illustrated in
Figure 3. As a vital energy source for the daily lives of urban residents, LNG has become an essential component of city gas supply. However, due to its inherent characteristics of high pressure and low temperature, once an accident occurs, the safety of life and property was directly threatened by LNG. Faced with the severe challenges posed by the safety situation of LNG supply stations, an in-depth investigation into the causes and multi-dimensional influencing factors of LNG supply station accidents, a comprehensive assessment of their safety risks, and the precise identification of their weak links were of critical importance for the achievement of their safe, efficient, and sustainable development.
Figure 3. Statistics of natural gas accidents from 2017 to 2023.
3. LNG Supply Stations Risk Assessment Indicators System
Relevant laws, regulations, and standards pertaining to the safety of LNG supply stations were collected from official websites. Additionally, a search was conducted in the National Full-text Standard Publication System using "LNG" as keywords. In summary, 17 laws, regulations, and standards were compiled. Based on this, and centered on the four aspects of unsafe human actions, unsafe conditions of equipment, environmental factors, and management deficiencies, a risk assessment system for LNG supply stations was ultimately established. The system comprises 18 risk assessment indicators across four dimensions: human factors, equipment and facility factors, environmental factors, and management factors. The established LNG supply station risk assessment indicators system was illustrated in
Table 1.
Table 1. LNG supply station risk assessment index system.
Number | Dimensions | Risk assessment indicators |
A11 | Human factors A1 | Lack of professional knowledge and skills |
A12 | Construction-related damage and human sabotage |
A13 | Violation of regulations and unsafe operations |
A14 | Poor communication and coordination |
A15 | Weak safety awareness |
A21 | Equipment and facility factors A2 | Design and construction deficiencies |
A22 | Failure of safety accessories |
A23 | Failure of safety protection facilities |
A24 | Failure of monitoring and early warning systems |
A31 | Environmental factors A3 | Unreasonable layout |
A32 | Inadequate ventilation and explosion protection |
A33 | Geological and climatic influences |
A34 | Corrosion and animal biting |
A41 | Management factors A4 | Inadequate safety education and training |
A42 | Insufficient safety supervision capacity |
A43 | Inadequate identification of potential hazards |
A44 | Incomplete rules and regulations |
A45 | Insufficient emergency rescue capability |
4. Research Methods
4.1. Method for Calculating Indicator Weights
Given that the importance of different risk assessment indicators for the safe and stable operation of LNG supply stations, as well as their impact on accident consequences, often varies significantly, an improved analytic hierarchy process (IAHP) and the entropy weighting method were introduced to quantitatively analyze the weights of risk assessment indicators for LNG supply stations. The IAHP determines the theoretical relative importance of risk assessment, while the entropy weighting method quantifies data uncertainty to evaluate the weights of indicators during the actual operation of LNG supply stations, thereby more accurately reflecting real-world scenarios
| [10] | Wang D, Yang G, Han J, et al. Quantitative assessment of human error of emergency behavior for hazardous chemical spills in chemical parks [J]. Process Safety and Environmental Protection, 2024, 189: 930-949.
https://doi.org/10.1016/J.PSEP.2024.06.107 |
[10]
. The specific steps were as follows:
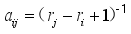
(1) Create a judgment matrix based on the following equation

.
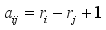
 (1)
(1) 
 (2)
(2) Calculate initial weights

.
 (3)
(3) 
 (4)
(4) (2) Calculate the entropy weight value using the principle of the entropy weight method.
Data standardization. Normalize the processing judgment matrix A and obtain the criterion matrix P.
 (5)
(5)  (6)
(6) Calculate the information entropy of each indicator.
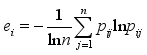 (7)
(7) Where,

represents the entropy value of the

indicator and

is the entropy coefficient.
Calculate entropy weights for each indicator.
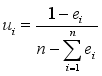 (8)
(8) (3) Calculate the weights of the combination of evaluation indicators through the multiplicative synthesis method.
 (9)
(9) As a result, the weighting values for the 18 safety assessment indicators for LNG supply stations were determined.
4.2. The Cloud Model
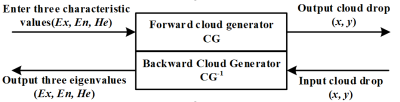
The cloud model unifies fuzziness and randomness into the mathematical representation C(Ex, En, He) of qualitative concepts through three numerical features, thereby enabling the flexible conversion between qualitative and quantitative information
| [11] | Wang H, Fei L, Feng Y. Cloud probability: A new uncertain model with fuzziness and randomness properties [J]. Journal of Intelligent & Fuzzy Systems, 2023, 44(4): 6089-6102.
https://doi.org/10.3233/JIFS-222518 |
[11]
. Both forward and reverse cloud generators support the generation of cloud droplet diagrams from numerical features and the extraction of numerical features from cloud droplet diagrams, respectively, thereby jointly facilitating bidirectional conversion between intension and extension, as well as between qualitative concepts and quantitative data
| [12] | Kan K, Binama M, Chen H, et al. Pump as turbine cavitation performance for both conventional and reverse operating modes: A review [J]. Renewable and Sustainable Energy Reviews, 2022, 168: 112786.
https://doi.org/10.1016/j.rser.2022.112786 |
[12]
, as illustrated in
Figure 4.
4.3. Risk Assessment Method for LNG Supply Station
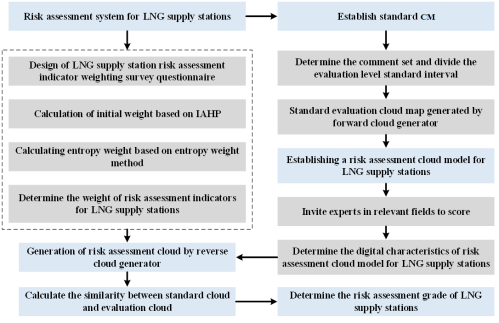
Through the integration of the IAHP and the entropy weight method for the determination of comprehensive indicator weights, the construction of a standard cloud model, the generation of indicator cloud models based on expert evaluations, the weighted hierarchical aggregation of these models to produce a comprehensive evaluation cloud, and the subsequent similarity measurement based on the principle of maximum membership degree, a comprehensive risk assessment method for LNG supply stations based on the cloud model was proposed, as illustrated in
Figure 5.
5. Case Study
5.1. Weights of Risk Assessment Indicators
The LNG supply station of Beijing H Gas Company (hereinafter referred to as H Supply Station), was selected as the case study for practical application. A questionnaire designed to determine the weights of risk assessment indicators for H Supply Station was administered for data collection. The comprehensive weights of the 18 risk assessment indicators for H Supply Station were calculated based on the IAHP and the entropy weight method, in accordance with Equations (
1) to (
7). The calculated weights were presented in
Table 2.
Table 2. Weight of risk assessment indicators for H Supply Station.
Dimensions | Weight | Indicator | Weight | Normalized weights |
A1 | 0.4978 | A11 | 0.1710 | 0.0851 |
A12 | 0.2542 | 0.1265 |
A13 | 0.3043 | 0.1515 |
A14 | 0.0970 | 0.0483 |
A15 | 0.1735 | 0.0864 |
A2 | 0.3568 | A21 | 0.4978 | 0.1776 |
A22 | 0.3568 | 0.1273 |
A23 | 0.0288 | 0.0103 |
A24 | 0.1166 | 0.0416 |
A3 | 0.0288 | A31 | 0.2219 | 0.0064 |
A32 | 0.5535 | 0.0159 |
A33 | 0.0027 | 0.0001 |
A34 | 0.2219 | 0.0064 |
A4 | 0.1166 | A41 | 0.1710 | 0.0199 |
A42 | 0.0970 | 0.0113 |
A43 | 0.3043 | 0.0355 |
A44 | 0.1735 | 0.0202 |
A45 | 0.2542 | 0.0296 |
5.2. Risk Assessment of H Supply Station
Based on the evaluation criteria for LNG supply stations stipulated in relevant laws, regulations, and standards, the safety level of an LNG supply station was classified into five distinct grades—"high," "relatively high," "medium," "relatively low," and "low"—within the universe of discourse [0, 10]. The numerical characteristic values of the cloud model for these evaluation grades were determined using Equations (
8) and (
9). The results were presented in
Table 3.
Table 3. Risk assessment language collection for the safety level of LNG supply stations.
Safety level | Scoring range | Cloud model digital characterization |
High | (9, 10] | (9.5, 0.17, 0.05) |
Relatively High | (8, 9] | (8.5, 0.17, 0.025) |
Medium | (7, 8] | (7.5, 0.17, 0.025) |
Relatively Low | (6, 7] | (6.5, 0.17, 0.025) |
Low | (0, 6] | (3.0, 1, 0.025) |
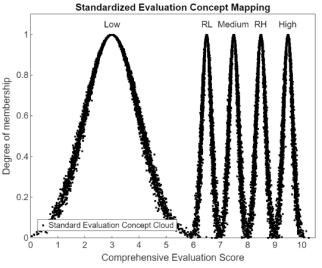
Based on the comment set determined according to the universe of discourse, the numerical characteristic values were input into the forward cloud generator, and the standard cloud diagrams corresponding to the safety level of H Supply Station were generated accordingly, as shown in
Figure 6.
Figure 6. Cloud map of safety level standard evaluation.
For the evaluation, a panel of nine experts was convened, based on the safety management system, hazard investigation and rectification status, and on-site inspection conditions of H Supply Station, a ten-point scoring system was employed to rate the safety level evaluation indicators. From the scoring results, the cloud parameters for the 18 indicators were derived using MATLAB software with a reverse cloud generator. By further incorporating the indicator weights presented in
Table 2, the risk assessment clouds for the human factors, equipment and facility factors, environmental factors, and management factors of H Supply Station were calculated. The results were shown in
Table 4.
Table 4. Risk assessment of cloud characteristic values.
Dimensions | C( ) ) | Indicator | C () |
A1 | (7.00, 0.87, 0.23) | A11 | (7.00, 0.98, 0.51) |
A12 | (7.11, 0.75, 0.12) |
A13 | (6.22, 0.93, 0.18) |
A14 | (7.22, 0.93, 0.18) |
A15 | (8.11, 0.74, 0.25) |
A2 | (7.60, 0.69, 0.17) | A21 | (8.22, 0.65, 0.15) |
A22 | (7.22, 0.65, 0.15) |
A23 | (7.22, 0.65, 0.15) |
A24 | (6.22, 0.93, 0.29) |
A3 | (7.46, 0.95, 0.22) | A31 | (7.00, 1.39, 0.26) |
A32 | (7.33, 0.83, 0.23) |
A33 | (7.89, 0.74, 0.25) |
A34 | (8.22, 0.65, 0.15) |
A4 | (7.84, 0.70, 0.30) | A41 | (7.11, 0.74, 0.25) |
A42 | (8.00, 0.83, 0.23) |
A43 | (8.00, 0.56, 0.44) |
A44 | (8.11, 0.74, 0.25) |
A45 | (7.89, 0.74, 0.25) |
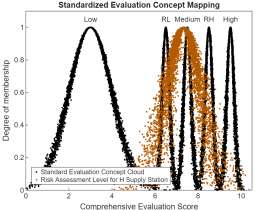
With 5,000 cloud droplets taken, the final cloud model parameters for the safety level of H Supply Station were calculated by incorporating the weight coefficients. The risk assessment cloud diagramwas subsequently generated using MATLAB, as shown in
Figure 7.
The similarity degree between the evaluation cloud and the standard cloud was calculated, and the results were presented in
Table 5. The maximum value obtained corresponds to the evaluation interval that most closely reflects the safety level of H Supply Station. Based on the above, the risk assessment cloud characteristic values for the safety level of H Supply Station were (7.33, 0.79, 0.22). The value of Ex indicates that the evaluation result approximates a "medium" level. The cloud diagram was observed to fit well with the standard cloud diagram, enabling the intuitive identification of the evaluation interval. From the calculated cloud similarity results, based on the principle of maximum similarity, the performance evaluation was also determined to be at a "medium" level. This consistency in the evaluation results was demonstrated, further reaffirming the scientific nature of the proposed evaluation method.
Table 5. Evaluate the similarity between cloud and standard cloud.
Standard Cloud | High | Relatively High | Medium | Relatively Low | Low |
Similarity Index | 0.070 | 0.203 | 0.340 | 0.285 | 0.102 |
6. Discussion
A systematic risk assessment system for LNG supply stations was established by integrating 18 indicators across four dimensions: human factors, equipment and facilities, environment, and management. This multidimensional framework addresses a recognized gap in the existing literature, where previous studies have often focused on isolated technical or managerial factors without constructing a holistic evaluation architecture. The proposed method, which combines the IAHP with the entropy weight method, effectively balances subjective expert judgment with objective data variability. This hybrid approach overcomes the limitations of single-weighting methods commonly reported in prior research, where subjective bias or data volatility tended to compromise the reliability of the assessments.
Furthermore, the application of cloud model theory allowed for the effective handling of the fuzziness and randomness inherent in risk assessment, offering a distinct advantage over conventional fuzzy comprehensive evaluation methods. The case study conducted on H Supply Station validated the practical applicability of this approach, demonstrating its capacity to yield results consistent with the actual safety management status of the facility.
However, certain limitations must be acknowledged. The generalizability of the findings may be constrained by the regional specificity of the case study, and the comprehensiveness of the indicator system could be further enhanced by incorporating additional contextual factors such as emergency response capabilities and external environmental dynamics.
Future research directions should therefore focus on refining the indicator system to account for regional heterogeneity, integrating intelligent evaluation techniques such as machine learning algorithms to enhance predictive accuracy, and developing dynamic risk assessment models that can adapt to evolving operational conditions. Such advancements would contribute to a more robust and universally applicable framework for the safety management of LNG supply stations.
7. Conclusions
1) A systematic risk assessment system for LNG supply stations was constructed, comprising 18 indicators derived from four dimensions: human factors, equipment and facilities, environment, and management. The development of this system was grounded in an analysis of national gas accident data from 2017 to 2023, relevant legal and regulatory frameworks, and practical insights obtained from safety inspections, thereby ensuring its theoretical soundness and practical relevance.
2) A hybrid weighting method integrating the IAHP with the entropy weight method was employed to determine the comprehensive weights of the risk indicators. On this basis, a novel risk assessment method was proposed based on cloud model theory, enabling the effective unification of randomness and fuzziness inherent in the evaluation process.
3) The rationality and effectiveness of the proposed method were substantiated through a case study conducted at the H LNG supply station in Beijing, where the comprehensive safety evaluation yielded cloud characteristic values of (7.33, 0.79, 0.22), indicating a safety level close to the medium level. This method provides both a theoretical foundation and practical guidance for the safety management of LNG supply stations, contributing to more scientific and systematic risk control practices in the gas industry.
Abbreviations
LNG | Liquefied Natural Gas |
AHP | Analytic Hierarchy Process |
IAHP | Improved Analytic Hierarchy Process |
Author Contributions
Dongdong Wang: Data curation, Formal analysis, Funding acquisition, Methodology, Writing – original draft
Ying Chen: Conceptualization, Methodology, Funding acquisition, Writing – review & editing.
Tong Wei: Software, Validation, Visualization, Writing – review & editing
Funding
The work are supported by the Beijing Academy of Science and Technology Talent Program (No. 26CE-BGS-29) and the Beijing Academy of Science and Technology Talent Program (No. 26CE-BGS-12).
Data Availability Statement
The data supporting the outcome of this research work has been reported in this manuscript.
Conflicts of Interest
The authors declare no conflicts of interest.
References
| [1] |
Guo D, Kong S, Li X, et al. Urbanization and subjective well-being of native urban residents: evidence from the “new-type urbanization pilot policy” in China [J]. The Annals of Regional Science, 2025, 74(1): 4.
https://doi.org/10.1007/S00168-024-01337-3
|
| [2] |
Ji Q, Fan Y, Troilo M, et al. China’s Natural Gas Demand Projections and Supply Capacity Analysis in 2030 [J]. The Energy Journal, 2018, 39(6): 53-70.
https://doi.org/10.5547/01956574.39.6.qji
|
| [3] |
Zou X, Qiu R, Zhang B, et al. Roadmap to urban energy internet: Techno-enviro-economic analysis of renewable electricity and natural gas integrated energy system [J]. Journal of Cleaner Production, 2022, 373: 133888.
https://doi.org/10.1016/J.JCLEPRO.2022.133888
|
| [4] |
Katebah M A, Hussein M M, Shazed A R, et al. Rigorous simulation, energy and environmental analysis of an actual baseload LNG supply chain [J]. Computers & Chemical Engineering, 2020, 141: 106993.
https://doi.org/10.1016/j.compchemeng.2020.106993
|
| [5] |
Zardasti L, Yahaya N, Valipour A, et al. Review on the identification of reputation loss indicators in an onshore pipeline explosion event [J]. Journal of Loss Prevention in the Process Industries, 2017, 48: 71-86.
https://doi.org/10.1016/j.jlp.2017.03.024
|
| [6] |
Chebli S, Tolba C, Zennir Y. Risk Assessment of an LNG Storage Tank Release: Case study of LNG storage unit in Skikda LNG terminal [J]. Algerian Journal of Signals and Systems, 2022, 7(2): 53-60.
https://doi.org/10.51485/ajss.v7i2.162
|
| [7] |
Animah I, Shafiee M. Application of risk analysis in the liquefied natural gas (LNG) sector: An overview [J]. Journal of Loss Prevention in the Process Industries, 2020, 63: 103980.
https://doi.org/10.1016/j.jlp.2019.103980
|
| [8] |
APRILIA P W, ARTANA K B, BALIWANGI L. Quantitative Risk Assessment Onshore LNG Regasification Unit (ORU) [C] //IOP Conference Series: Earth and Environmental Science. IOP Publishing, 2020, 557(1):
https://doi.org/012001.10.1088/1755-1315/557/1/012001
|
| [9] |
James S, Renjith V R. Risk assessment and vulnerability analysis of liquefied natural gas (LNG) regasification terminal [J]. Process Integration and Optimization for Sustainability, 2021, 5(1): 99-121.
https://doi.org/10.1007/s41660-020-00138-3
|
| [10] |
Wang D, Yang G, Han J, et al. Quantitative assessment of human error of emergency behavior for hazardous chemical spills in chemical parks [J]. Process Safety and Environmental Protection, 2024, 189: 930-949.
https://doi.org/10.1016/J.PSEP.2024.06.107
|
| [11] |
Wang H, Fei L, Feng Y. Cloud probability: A new uncertain model with fuzziness and randomness properties [J]. Journal of Intelligent & Fuzzy Systems, 2023, 44(4): 6089-6102.
https://doi.org/10.3233/JIFS-222518
|
| [12] |
Kan K, Binama M, Chen H, et al. Pump as turbine cavitation performance for both conventional and reverse operating modes: A review [J]. Renewable and Sustainable Energy Reviews, 2022, 168: 112786.
https://doi.org/10.1016/j.rser.2022.112786
|
Cite This Article
-
APA Style
Wang, D., Chen, Y., Wei, T. (2026). Risk Assessment of LNG Supply Stations Based on Cloud Model. International Journal of Energy and Environmental Science, 11(3), 55-64. https://doi.org/10.11648/j.ijees.20261103.12
 Copy
|
Copy
|
 Download
ACS Style
Wang, D.; Chen, Y.; Wei, T. Risk Assessment of LNG Supply Stations Based on Cloud Model. Int. J. Energy Environ. Sci. 2026, 11(3), 55-64. doi: 10.11648/j.ijees.20261103.12
Copy
|
Download
AMA Style
Wang D, Chen Y, Wei T. Risk Assessment of LNG Supply Stations Based on Cloud Model. Int J Energy Environ Sci. 2026;11(3):55-64. doi: 10.11648/j.ijees.20261103.12
Copy
|
Download
-
@article{10.11648/j.ijees.20261103.12,
  author = {Dongdong Wang and Ying Chen and Tong Wei},
  title = {Risk Assessment of LNG Supply Stations Based on Cloud Model},
  journal = {International Journal of Energy and Environmental Science},
  volume = {11},
  number = {3},
  pages = {55-64},
  doi = {10.11648/j.ijees.20261103.12},
  url = {https://doi.org/10.11648/j.ijees.20261103.12},
  eprint = {https://article.sciencepublishinggroup.com/pdf/10.11648.j.ijees.20261103.12},
  abstract = {In the context of the energy transition towards "carbon peak" and "carbon neutrality" as well as the shift from coal to natural gas, the liquefied natural gas (LNG) industry has experienced rapid development. Nevertheless, frequent LNG accidents pose a serious threat to people's lives and property safety. Based on the statistical analysis of the data of gas accidents that occurred in China from 2017 to 2023, with the aim of exploring the safety risk factors of LNG supply stations, a comprehensive evaluation system for the safety level of liquefied natural gas supply station was established, encompassing four dimensions: human factor, equipment and facilities, environment, and management. By integrating cloud model, improved analytic hierarchy process and entropy weight method, a comprehensive evaluation method for the safety level of LNG gas supply station was proposed. Finally, the method was applied to the H LNG Supply Station in Beijing, the results show that the cloud characteristic values of the risk assessment level of H gas supply station were (7.33, 0.79, 0.22) and the risk assessment results were close to the medium level. The research results verify the effectiveness of the evaluation method, which can provide a theoretical basis for the safety management and scientific evaluation of LNG supply stations.},
 year = {2026}
}
Copy
|
Download
-
TY  - JOUR
T1  - Risk Assessment of LNG Supply Stations Based on Cloud Model
AU  - Dongdong Wang
AU  - Ying Chen
AU  - Tong Wei
Y1  - 2026/07/11
PY  - 2026
N1  - https://doi.org/10.11648/j.ijees.20261103.12
DO  - 10.11648/j.ijees.20261103.12
T2  - International Journal of Energy and Environmental Science
JF  - International Journal of Energy and Environmental Science
JO  - International Journal of Energy and Environmental Science
SP  - 55
EP  - 64
PB  - Science Publishing Group
SN  - 2578-9546
UR  - https://doi.org/10.11648/j.ijees.20261103.12
AB  - In the context of the energy transition towards "carbon peak" and "carbon neutrality" as well as the shift from coal to natural gas, the liquefied natural gas (LNG) industry has experienced rapid development. Nevertheless, frequent LNG accidents pose a serious threat to people's lives and property safety. Based on the statistical analysis of the data of gas accidents that occurred in China from 2017 to 2023, with the aim of exploring the safety risk factors of LNG supply stations, a comprehensive evaluation system for the safety level of liquefied natural gas supply station was established, encompassing four dimensions: human factor, equipment and facilities, environment, and management. By integrating cloud model, improved analytic hierarchy process and entropy weight method, a comprehensive evaluation method for the safety level of LNG gas supply station was proposed. Finally, the method was applied to the H LNG Supply Station in Beijing, the results show that the cloud characteristic values of the risk assessment level of H gas supply station were (7.33, 0.79, 0.22) and the risk assessment results were close to the medium level. The research results verify the effectiveness of the evaluation method, which can provide a theoretical basis for the safety management and scientific evaluation of LNG supply stations.
VL  - 11
IS  - 3
ER  -
Copy
|
Download





 Share This Article
 Twitter
 Linked In
 Facebook